Justifying Developer Experience Investment to Non-Engineering Leadership
Frame developer experience as a financial control, not a perk.
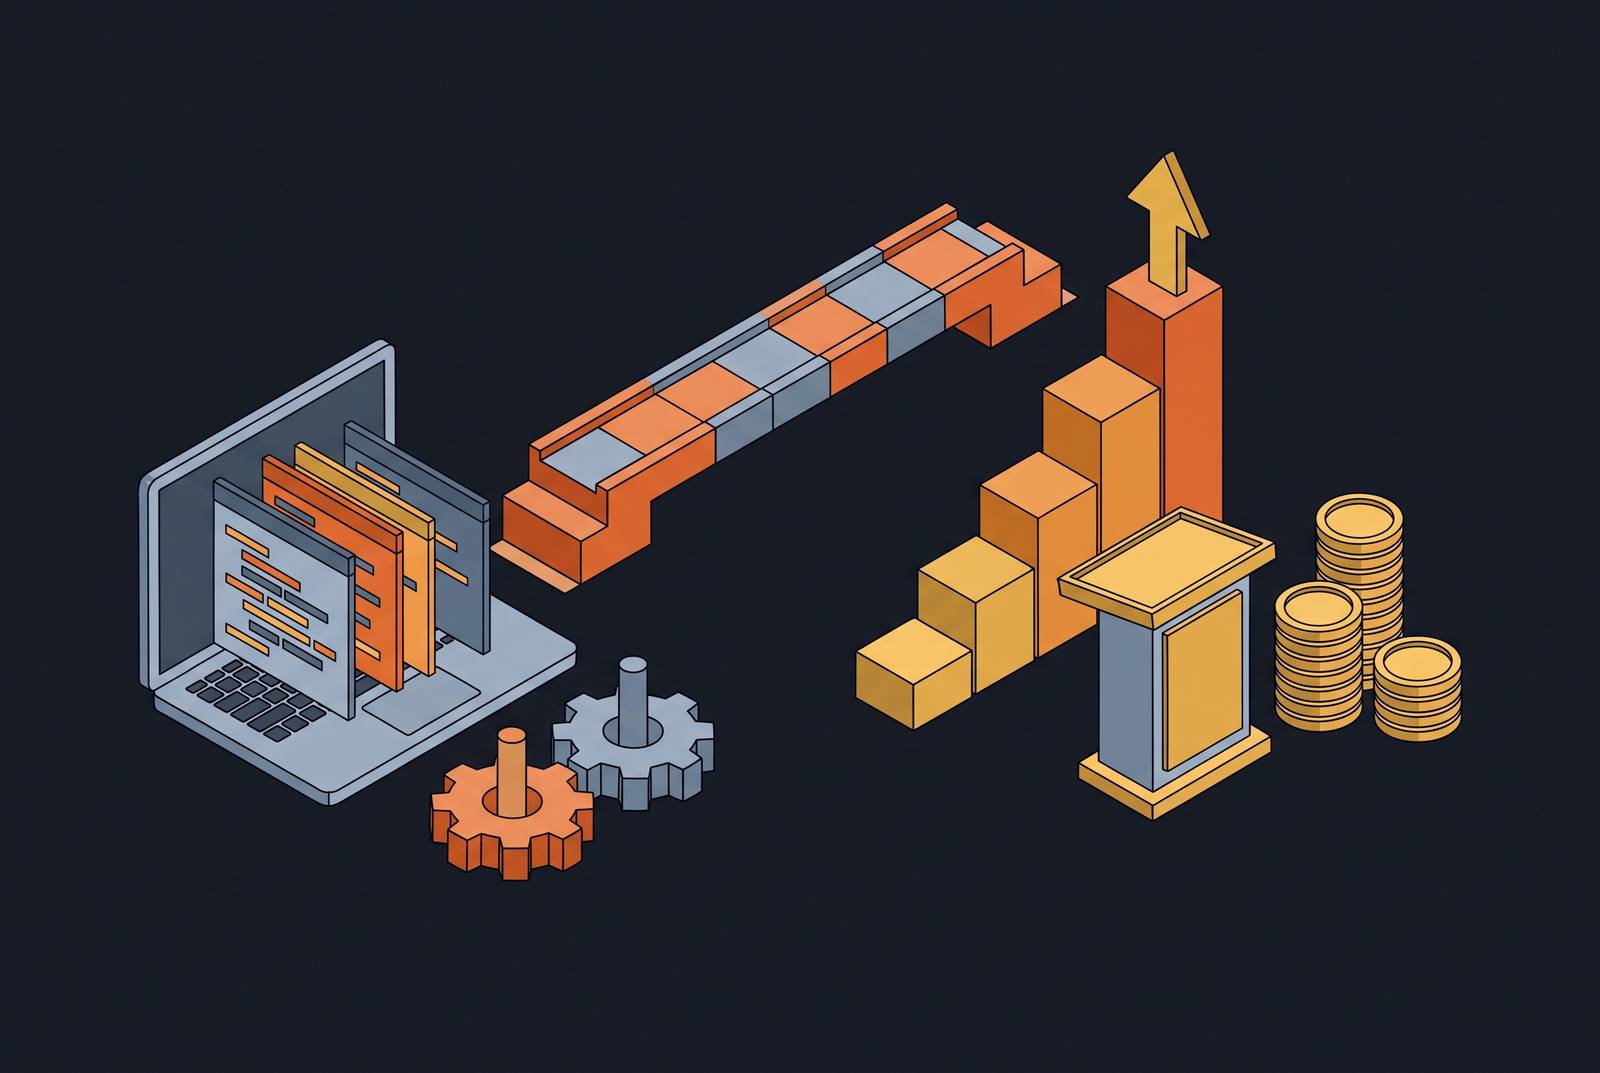
Engineering leaders keep losing the budget argument for developer experience, and the reason has nothing to do with whether developer experience improves cycle time, deployment frequency, or cognitive load. It has to do with translation. Cycle time, deployment frequency, cognitive load: these are the terms an engineering leader reaches for naturally, and they are close to meaningless to a CFO who thinks in risk, cost, and competitive exposure. Developer experience gets filed under "productivity perk" or "HR concern" instead of what it actually is: a financial control. That misfiling dooms the budget ask before anyone even reads the deck.
Gartner's research found that teams with high-quality developer experiences are 20% more likely to retain their talent. Read as an HR stat, that number is forgettable. Read as a CEO-level exposure sitting quietly inside an engineering slide, it's something else entirely. Add the projected shortage of over 1.2 million software engineers by 2026 for a specific country. shortage of over 1.2 million software engineers by 2026, and scarcity turns every retention failure into something costlier than the org chart suggests. Annual engineering attrition already runs at 13.2%. That is not an edge case a company might hit in a bad year. That is the baseline most teams are living in right now, whether anyone in the finance meeting realizes it or not.
None of this changes what engineering leaders already know. It changes how that knowledge gets said out loud in a room that doesn't speak engineering. What follows is the translation layer, run through the numbers finance actually cares about.
What attrition costs when you run the numbers for finance
Start with the replacement cost, because it's the easiest number to defend. Industry analysis puts the cost of replacing an engineer at 50% to 200% of that engineer's annual salary. On a median developer wage of $133,000, that range works out to $66,500 to $266,000 per departure. Put that number on a slide next to a resignation letter and the conversation changes shape immediately.
Break it down further for a finance audience, because they'll want the components, not just the headline figure. There are recruitment fees, often billed by agencies as a percentage of first-year salary. There's onboarding and hardware provisioning, which documented estimates place at roughly $5,000 per hire. And there's the quieter cost: productivity loss during ramp-up, where a new hire draws on senior time and team bandwidth for months before delivering full value back.
Then there's a compounding effect that rarely makes it into a retention memo. Call it the "hollow senior" problem. When attrition strips out the engineers who carry architectural knowledge in their heads, junior developers are left navigating complex codebases without a guide. Errors multiply. Delivery slows. And the slowdown itself becomes a reason for more people to leave. This is a balance-sheet risk that compounds quarter over quarter, not a morale issue tucked into an engagement survey. It's a balance-sheet risk that compounds quarter over quarter.
Run the model on a mid-sized team and the exposure gets concrete fast. Run the replacement cost range against a 50-engineer organization at 20% annual turnover and the direct exposure reaches into the hundreds of thousands annually, and that figure doesn't even touch delayed features or the institutional knowledge that walked out the door. Attrition is a capital efficiency problem, and weak developer experience is a documented driver of it. It's a capital efficiency problem, and weak developer experience is a documented driver of it.
Retention is the most legible cost of the three this article will walk through, mostly because it appears eventually as a line item in a recruiting invoice or a backfill req. The next exposure appears nowhere on a balance sheet or dashboard. It just quietly eats capacity every week, whether anyone leaves or not.
The productivity tax that never shows up as a line item
JetBrains' 2026 analysis found engineering teams losing as much as 20% of weekly time to inefficiencies, technical debt, maintenance work, and tooling friction, time that isn't going toward product work at all. Twenty percent sounds abstract until it's converted into a day. On a 50-engineer team, that's one full day per engineer, every week, paid for and never used. That's a material operating loss hiding inside a cost center everyone already approved, not a rounding error on a headcount budget. That's a material operating loss hiding inside a cost center everyone already approved.
Translate it into cost-per-change and the number gets sharper still. A 50-engineer organization running at a substantial quarterly cost, shipping 600 production changes in that window, is operating at $3,750 per change. Every hour of avoidable friction, every stuck build, every confusing legacy module, pushes that number up. It's a live figure, not a static one.
Separate research on delivery performance backs this up from a different angle: organizations in the top quartile of developer experience scores show engineering speed and quality four to five times higher than bottom-quartile performers. That's a different competitive tier entirely, not a marginal edge one team has over another, and the gap doesn't close on its own. That's a different competitive tier entirely, and the gap doesn't close on its own.
The Developer Experience Index (DXI) offers a useful unit for this argument, because each point gained on the index saves roughly 13 minutes per developer per week. Thirteen minutes sounds small until it's multiplied across a headcount and a fiscal year. Documented cases show optimized development environments cutting infrastructure setup time from three months down to one week, a delta that converts directly into engineer-hours handed back to product work.
The CFO framing recovers capacity the organization has already paid for and is currently losing to friction, which the engineering framing in this section does not capture as directly. This is about recovering capacity the organization has already paid for and is currently losing to friction, not about whether engineers feel happier at their desks. It's about recovering capacity the organization has already paid for and is currently losing to friction. The spend is sunk. The output isn't, not yet.
Friction and attrition are both real costs, and both are, at least, familiar ones. The third exposure is newer, growing faster, and far less understood inside most finance conversations: the gap between what AI tools promise and what weak infrastructure lets them deliver.
Why AI tool ROI depends on the infrastructure underneath it
Gartner estimated the enterprise AI coding agent market at $9.8 billion to $11.0 billion annualized. That's a line item leadership already has opinions about, likely strong ones, because someone in finance approved the seat licenses. The coding and software development segment of the broader AI agents market is projected to grow at a 52.4% compound annual rate from 2025 to 2030. Pressure to justify that spend with results is accelerating. It's accelerating.
McKinsey's 2025 State of AI survey, covering 1,993 participants across 105 countries, found that agentic AI adoption is now close to universal, but scaling that adoption into real breakthrough impact remains rare. Almost everyone is getting something out of these tools. Very few are getting transformation. Gartner projects that over 40% of agentic AI projects will be canceled by 2027, and the projects that survive will be the ones built on infrastructure that actually lets the agents do useful work.
The ROI numbers, when they're real, are strong. Average returns on AI coding tools run several times over, with top-quartile performers seeing 4 to 6 times. But that range only holds when the cost side of the equation includes actual token and usage spend, not just the seat license number that finance signed off on. Agentic tools can run $200 to $2,000 or more per engineer per month in token costs alone, with total AI tool spend averaging $200 to $600 per engineer monthly, a figure that often has nothing to do with what leadership thought it approved.
IBM's CEO study puts a hard number on the disappointment: only 25% of AI initiatives delivered the ROI leadership expected going in. The gap between deploying an AI tool and actually getting value from it is almost never a model quality problem. It's a context and infrastructure problem, and it has a specific name.
What "codebase context" means and why it determines whether AI agents work
Think of it as a three-part system. The agent is the engine. The Model Context Protocol, or MCP, is the wiring. Codebase context is the fuel. A great engine running on bad fuel still stalls, and that's exactly what happens when an AI coding tool gets dropped into a codebase it doesn't actually understand.
AI coding tools are generally capable at generating code within the boundaries of a single project. The trouble starts at the edges of that project. These tools operate largely in isolation from the broader codebase, which means they can't answer the questions that matter most once an organization grows past a certain size: where else is this API consumed, what's the blast radius of this change, who still depends on that function marked for deprecation six months ago. In practice, a substantial share of agent working time goes to search and navigation rather than actual problem-solving. That's overhead, not value, and it compounds across every engineer running the tool in parallel.
A token economics problem causes this: dumping an entire codebase into a context window adds cost and latency without improving accuracy. Dumping an entire codebase into a context window doesn't solve the problem of the model losing visibility into the code, it just adds cost and latency without improving accuracy. Agents have, in documented cases, performed worse with a bloated codebase summary than with a smaller, targeted retrieval on the exact same task. Better context retrieval reduces both token consumption and tool-call overhead in measured cases, and both improvements translate directly into dollars saved per session, not just faster responses.
Speed without context carries a quality cost too. GitClear's 2024 data shows code churn rising from a 3.3% baseline before generative AI tools were common, in 2021, up to a range of 5.7% to 7.1% in 2024 and 2025. Shipping more code faster is not the same as shipping more value faster, and churn is rework, which is cost by another name. Veracode's 2025 GenAI Code Security Report adds a sharper edge: AI-generated code showed a 45% vulnerability rate. Without strong context and governance controls wrapped around these tools, speed gains arrive with security liabilities attached.
Anthropic introduced MCP in November 2024 as a standard way to connect AI agents to external tools and data sources. As of December 2025, the ecosystem had grown to more than 10,000 active public MCP servers and over 97 million monthly SDK downloads, numbers that make MCP the de facto standard for connecting AI agents to the systems they need to reason over. Code-specific implementations of MCP let agents query across repositories at runtime, which means the entity asking "where is this pattern used elsewhere" is increasingly an agent rather than a person, and the quality of the answer it gets back determines the quality of everything it produces next.
This is the gap separating organizations seeing average returns of 2.5 to 3.5x from top-quartile performers reaching 4 to 6x. It's better fuel, not a better model.
How to frame the infrastructure investment for a CFO or CEO
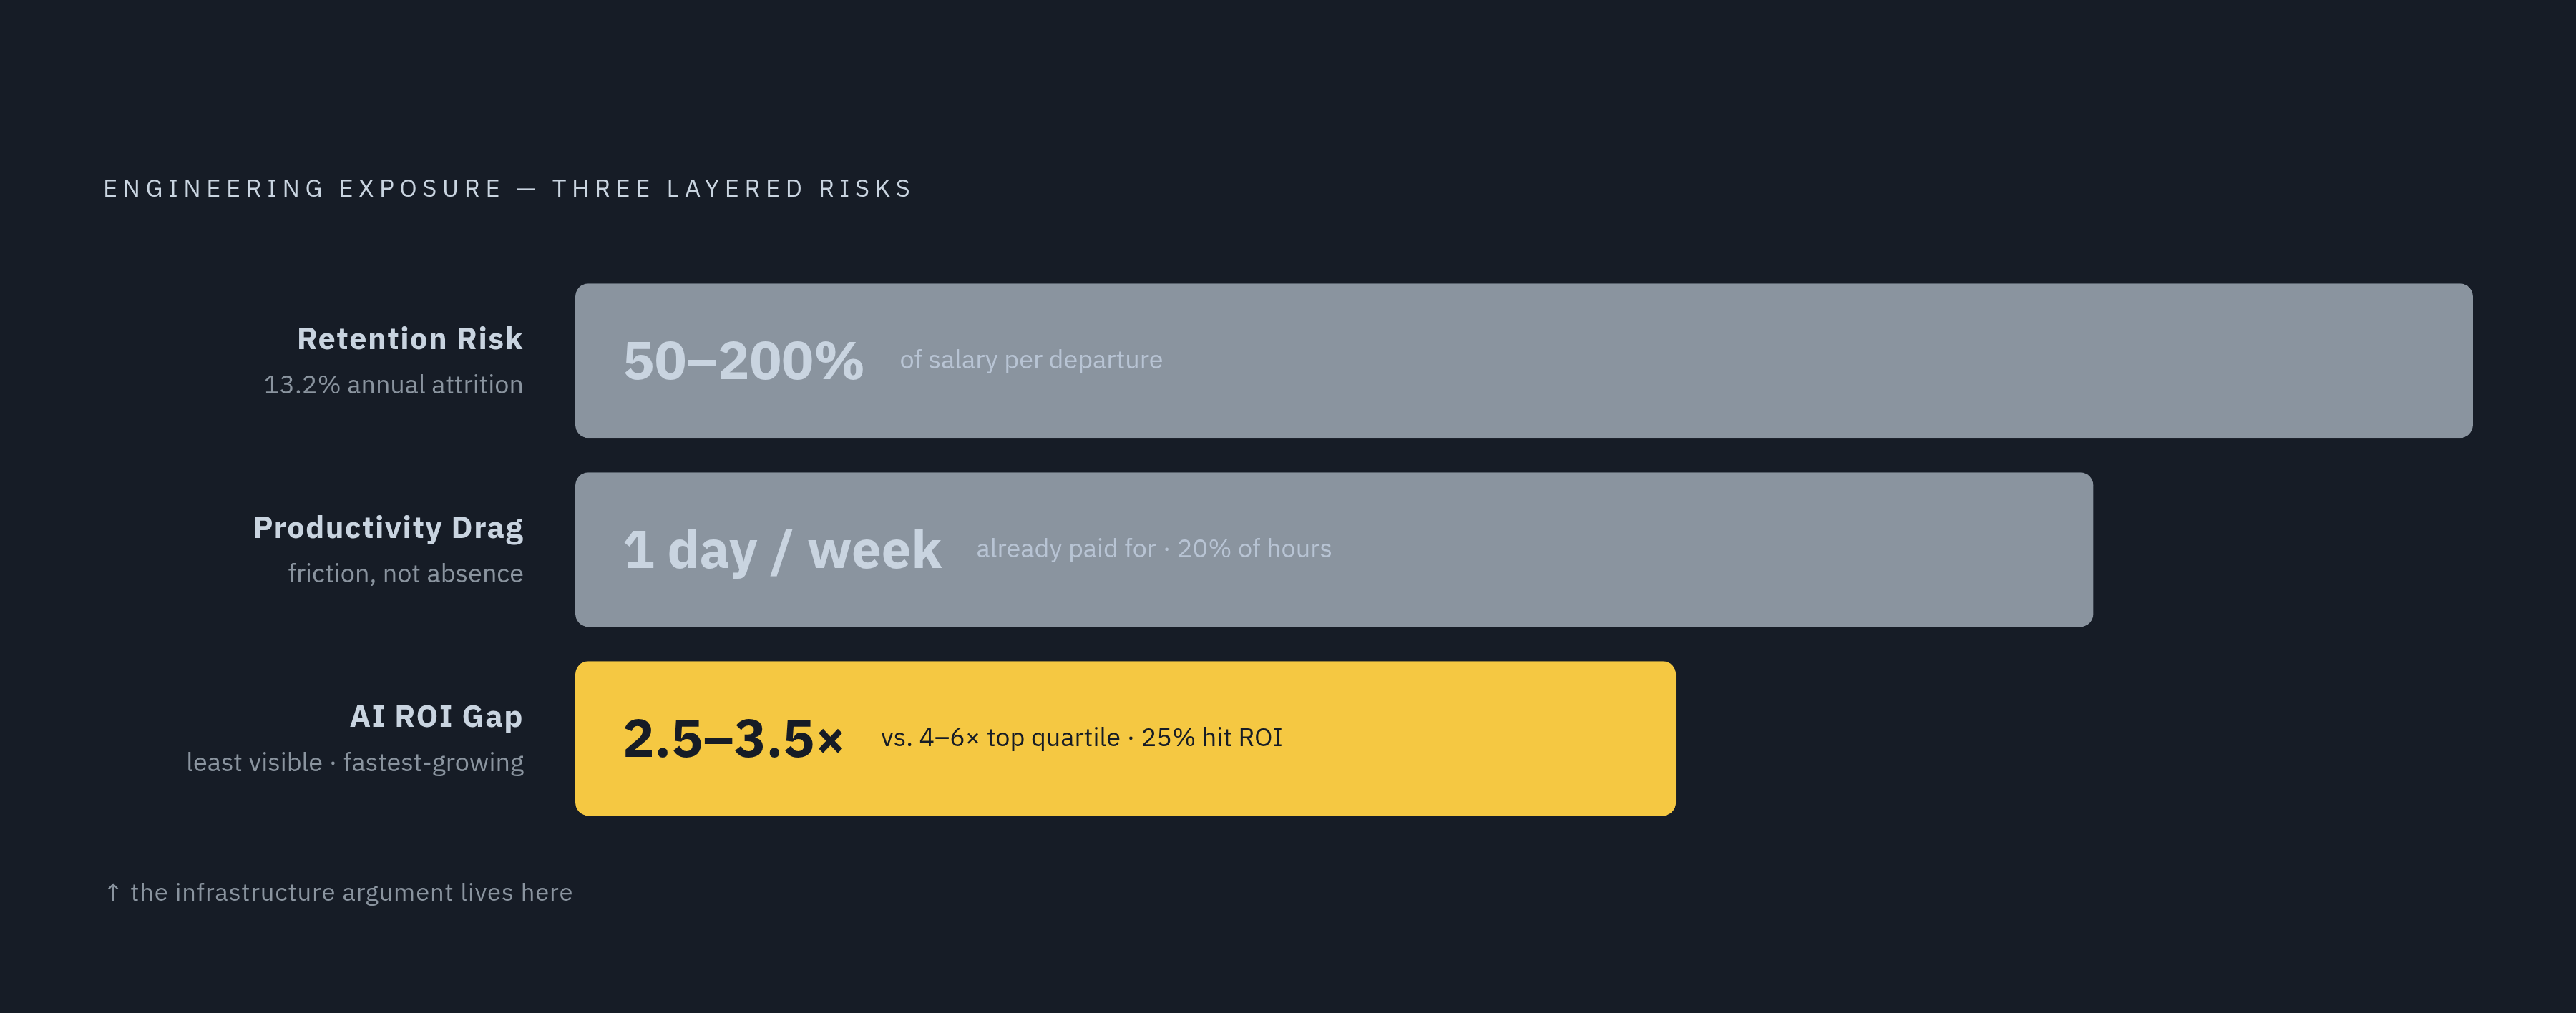
The pitch works better as risk mitigation than as a spending request. Frame developer experience investment as addressing three exposures that are already sitting on the books, whether anyone has priced them yet or not.
Retention risk comes first: replacement costs running 50% to 200% of salary per departure, against a 13.2% annual attrition rate that functions as the baseline probability of that cost landing. Productivity drag comes second: 20% of weekly engineering time lost to friction, capacity the organization has already paid for in headcount cost and isn't getting back. AI ROI gap comes third: IDC and Microsoft have put average returns on generative AI investment at several times the initial outlay, yet IBM found only 25% of AI initiatives hitting their expected ROI. The distance between those two numbers is the infrastructure gap, and unlike a lot of costs in a P&L, this one is recoverable.
Security-minded leadership needs a specific version of this argument. UiPath's Agentic AI Report found that 56% of enterprise leaders name security vulnerabilities as their top concern with AI tools. Self-hosted code intelligence, infrastructure that keeps proprietary code inside the organization's own environment rather than routing it through a third party, speaks directly to that concern. It reframes the investment as a governance and compliance line item, not just a productivity one, which tends to widen the coalition of people willing to approve it.
There's a procurement angle: the ability to choose an LLM provider and keep full control over where code actually gets sent. That's a data sovereignty argument, and it lands with legal, compliance, and the CFO at the same time, which is rare for a single argument to do. On cost structure, cloud-hosted code intelligence tools tend to carry ongoing per-seat pricing plus data egress exposure, while self-hosted alternatives deployed as a single container remove both variables. That's a total cost of ownership case, not a features comparison, and it's the kind of case a CFO can actually model.
For teams worried about the risk of getting this wrong, a free tier that indexes real repositories offers a way to prove value before anyone signs a contract. Present that to leadership as a low-risk pilot structure, not a speculative bet. Gartner predicts that by 2027, more than 65% of engineering teams using agentic coding will treat IDEs as optional, shifting control and validation onto automated platforms instead. The infrastructure built today decides whether an organization leads that shift or scrambles to catch up once it's already underway.
Whatever the pitch ends up looking like, it should not lead with deployment frequency, lead time, or MTTR. Lead with risk and what it costs to recover from it. Metrics come in afterward, as evidence, not as the headline.
Making the case concrete: the numbers and narrative that move a room
One line can open the meeting: the organization is currently paying for engineering capacity it isn't receiving, and here's what that costs and what it takes to get it back.
From there, the model can be built live, on a whiteboard, in front of the room. Start with headcount and loaded cost per engineer. Apply the 20% friction tax to get a dollar figure for lost productivity per quarter. Apply the 13.2% attrition rate to estimate expected departures for the year and the replacement cost range that follows. Then layer in AI tool spend, $200 to $600 per engineer per month, and ask the room directly which ROI tier the organization is actually sitting in, 2.5x or 6x, and what the gap between those two numbers is worth in dollars.
The DXI framing closes the loop nicely: each point gained on the index saves about 13 minutes per developer per week, and multiplying that across headcount and a full year turns a small number into a return that's hard to argue with. The Platform Engineering & Developer Experience Summit, scheduled for October 21 to 22, 2026, at the Hilton London Syon Park, is drawing engineering leaders from organizations including IKEA, BlackRock, and Lloyds Banking Group to discuss exactly this problem. This is a mainstream enterprise conversation now, not a pet project running in one engineering org.
Structure the ask as a pilot with a defined measurement window. Index real repositories, measure the token cost reduction and the engineer-hours recovered, and compare the results against the baseline before asking for anything bigger. Good developer experience compounds in a way that's easy to underestimate on paper: a minute saved in one workflow becomes hours once it's multiplied across teams and repeated week after week, and the organizations building this infrastructure now are quietly widening a cost and speed advantage that gets harder to close every quarter that passes.
The request, in the end, is for permission to recover value from engineering spend the organization has already committed, not for more money to spend on engineering tools. It's for permission to recover value from engineering spend the organization has already committed.