Measuring the Productivity Impact of AI Coding Tools in Engineering Teams
Speed gains disappear when you measure what actually ships and breaks.

Measuring the Productivity Impact of AI Coding Tools in Engineering Teams.
Why the headline metric for AI coding tools is usually the wrong one
Individual productivity gains from AI coding tools mean a team that measures only speed will eventually mistake motion for progress, because speed is the wrong thing to optimize for in isolation. The default story engineering leaders tell is simple enough: developers adopt the tools, output climbs, and someone in a quarterly review declares victory. That story isn't wrong so much as incomplete. Adoption itself is no longer in question. Roughly 84% of developers now use AI tools or plan to, and 51% of professional developers use them daily, according to the Stack Overflow Developer Survey securityboulevard.com. So the debate has moved past whether teams should adopt these tools and toward what actually happens once they do, at scale, over months rather than days. The temptation is to reduce that question to a single number, lines written per hour, tasks closed per sprint, and call it productivity. That shortcut fails because it mistakes local acceleration, something happening faster at one desk, for system-level improvement across an entire delivery pipeline. The rest of this piece builds the case for a measurement framework wide enough to catch what a single metric buries.
What the speed numbers show (and what they hide)
The gains being reported are not imaginary. Jellyfish's analysis of data spanning July 2024 through June 2025 found that teams moving from zero adoption of coding assistants to full adoption cut median pull request cycle times by 24%. These are not trivial figures, and dismissing them would be its own kind of dishonesty.
But look closer at what's being counted. AI now generates 41% of all code written, according to a report from index.dev. That's a volume signal, not a value signal. A pull request can be larger, faster, and more numerous while contributing nothing more useful than a pull request that took three times as long to write. None of the figures above measure whether the software that results ships sooner, breaks less, or serves users better. They measure the front end of the pipeline, the moment code gets typed, and leave the rest of the system's behavior an open question. Developers report 10–30% productivity increases on average. DX data presented by Laura Tacho at The Pragmatic Summit showed approximately 4 hours per week saved per developer.
The productivity paradox: why experienced developers can feel faster while being slower
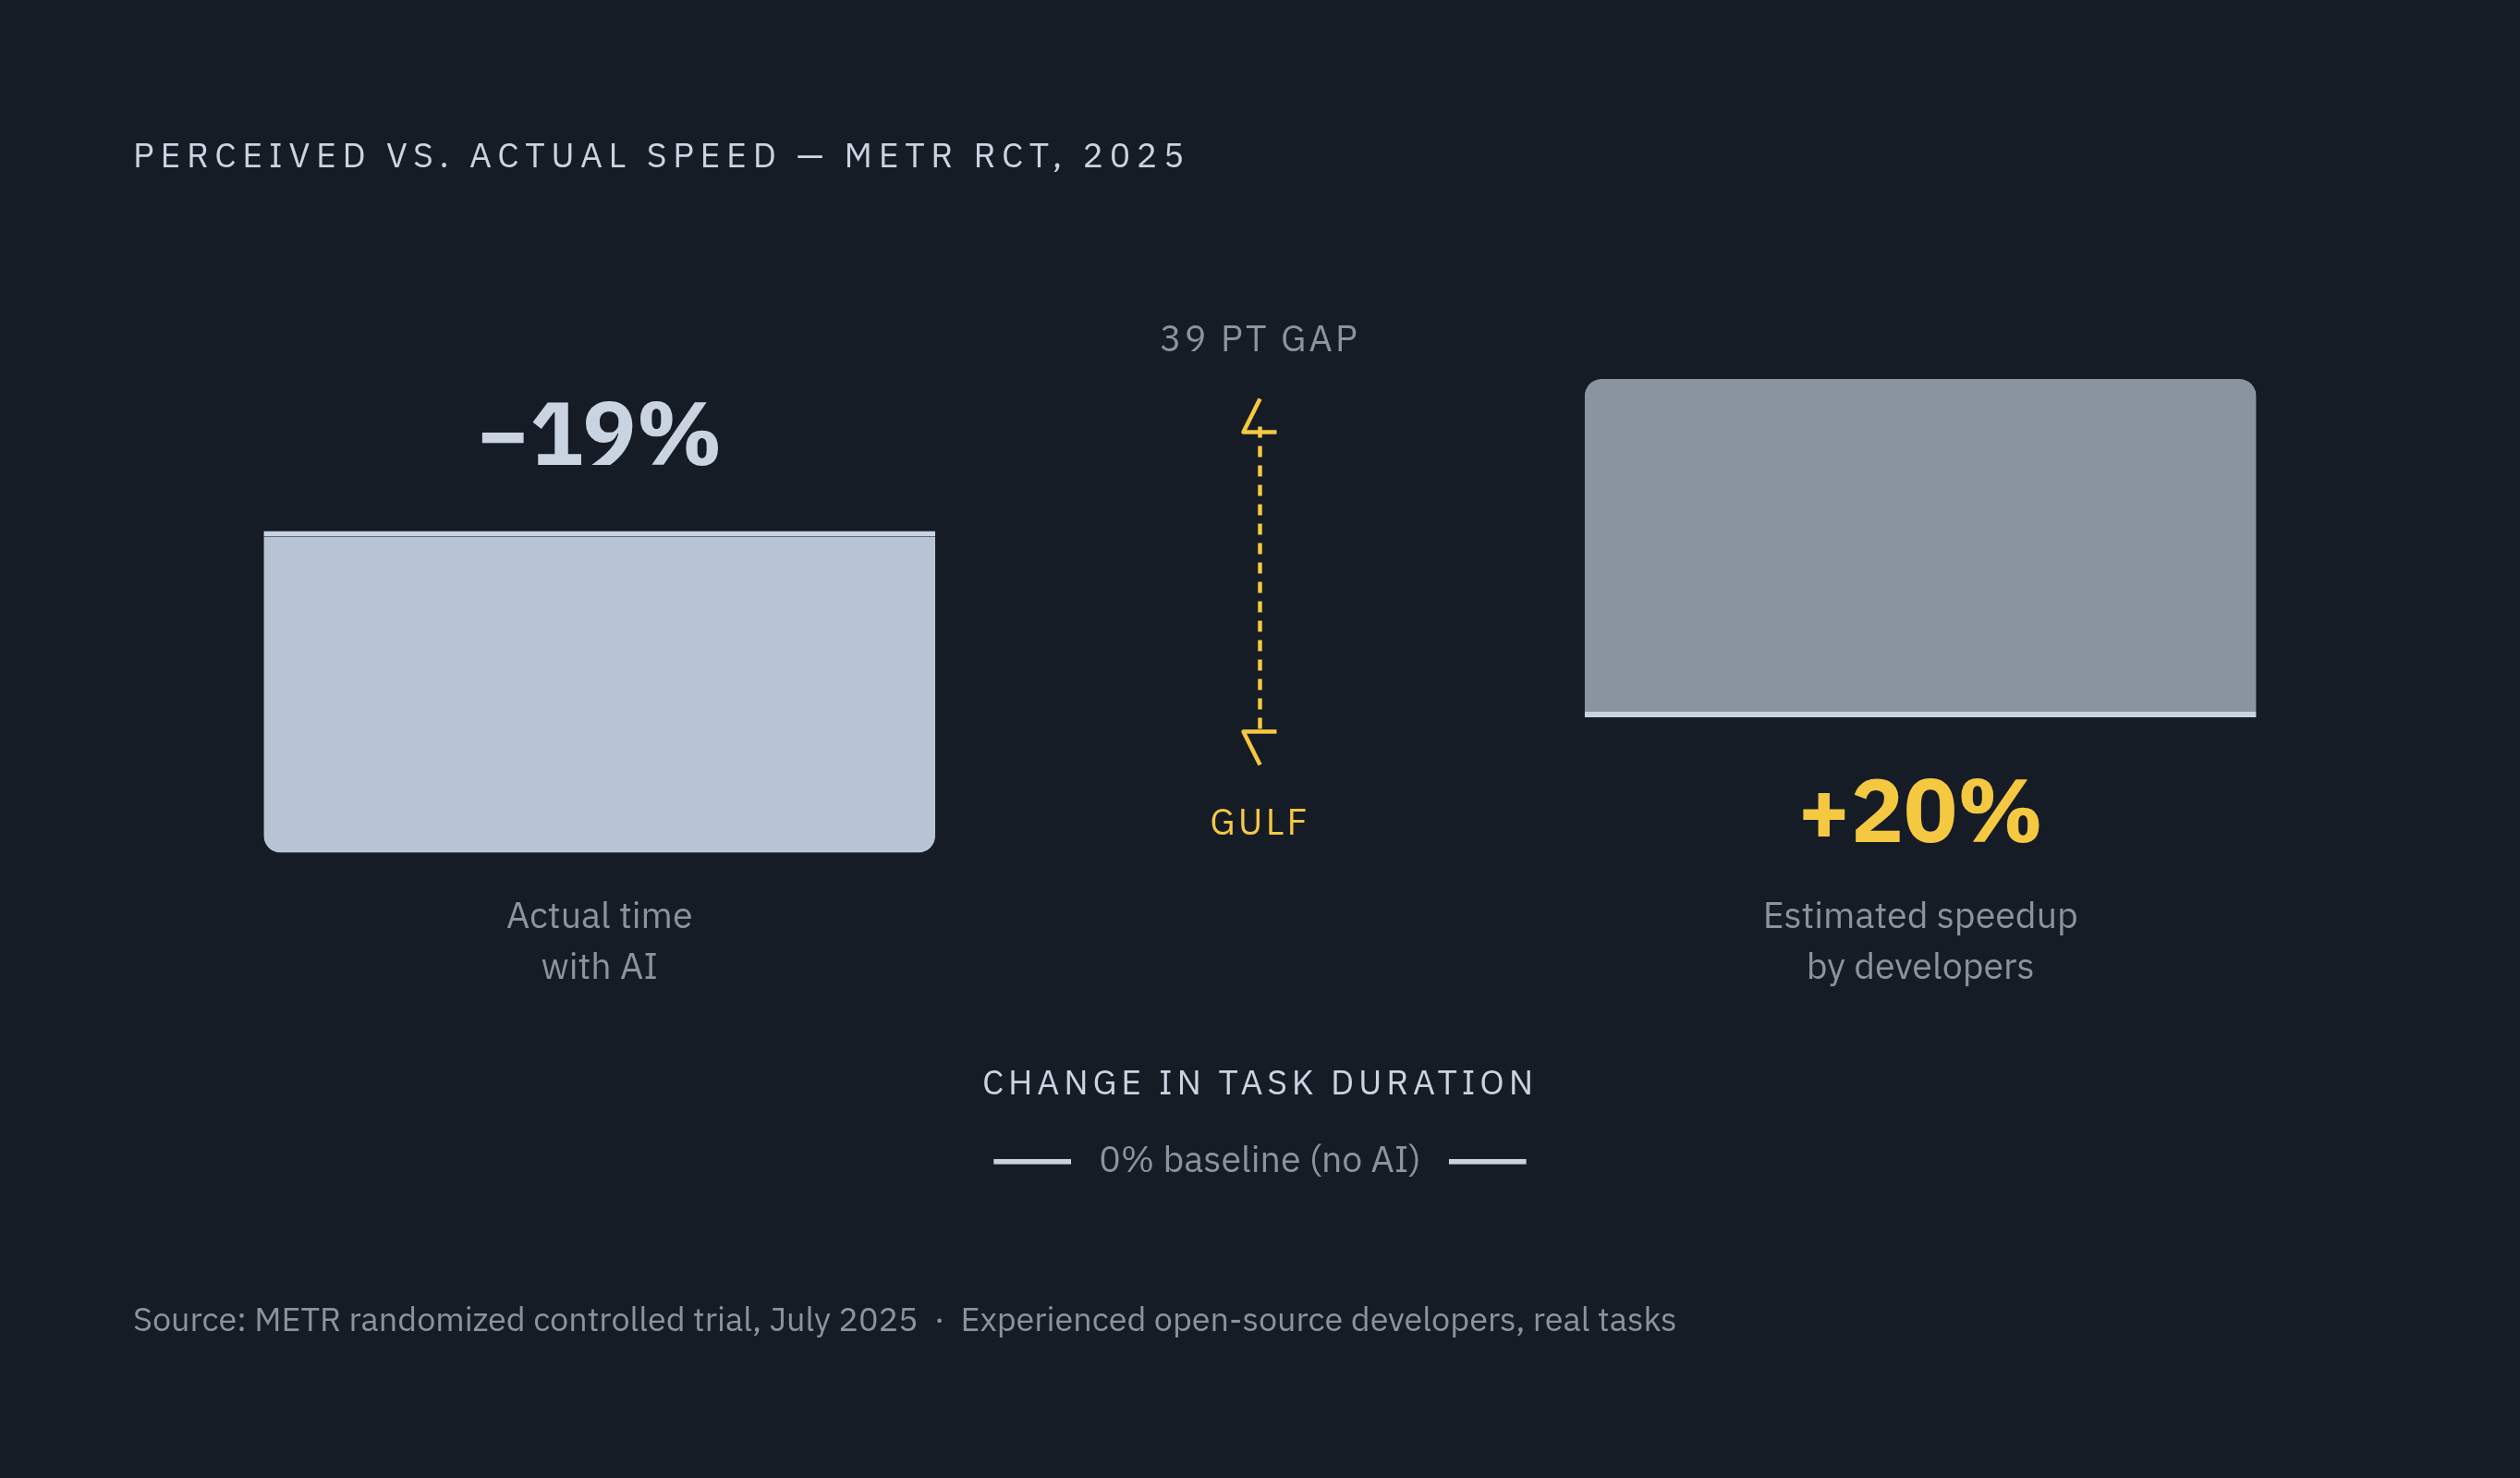
That open question has an answer, and it is uncomfortable. METR ran a randomized controlled trial in July 2025 on experienced open-source developers working in their own repositories. The developers using AI tools took 19% longer to complete their tasks than those working without them Measuring the Impact of Early-2025 AI on Experienced Open-Source Deve…. Asked afterward how they'd done, those same developers estimated they'd been sped up by 20%, a gap far too large to be a rounding error Measuring the Impact of Early-2025 AI on Experienced Open-Source Deve….
The paradox holds up under longer observation, too. A longitudinal study by Vella and Blincoe at the University of Auckland, published on arXiv in May 2026, tracked 95 matched professional engineers over six months. At both points in the study, 84% of participants reported a productivity improvement, so the perception of speed held remarkably steady securityboulevard.com. Yet among those same matched participants, the share reporting worsened developer experience in at least one dimension nearly doubled, climbing from 14% to 27%. Flow state eroded. Cognitive load crept up even as feedback loops got tighter.
A separate study out of Oregon State, presented at FSE '26 and titled "The Fast and Spurious," surveyed 415 practitioners and found the same shape of result. The authors' word for the productivity gains at this stage of adoption is "spurious." Any measurement framework that counts only output volume or takes self-reported speed at face value will systematically overstate what's actually being gained. The term "supervisory engineering work" is introduced to describe how direction, evaluation, and correction of AI output constitute a new category of labor that standard metrics don't capture.
Where the bottleneck moves when coding accelerates
Plandek's Engineering Productivity Benchmarks, drawn from an analysis of more than 2,000 software engineering teams worldwide, found something that should reframe how leadership reads AI's impact. Lower-performing teams that adopted AI cut their Lead Time to Value by nearly 50%. Top-performing teams, using the same tools, improved only 10 to 15%, a roughly fourfold difference in impact. AI removes friction at the coding stage specifically, so teams that already had little friction there simply have less room to gain.
Meanwhile, as developers generate more code faster, the pressure that used to sit at the keyboard relocates into review, testing, and integration, which absorb the overflow. The constraint has relocated rather than disappeared. Plandek's data on how time gets spent tells the same story from a different angle: high-performing teams put more than 41% of their time toward roadmap delivery, while lower-performing teams manage less than 21%, with the remainder eaten by bugs, incidents, and unplanned work.
AI does not repair a broken delivery system. It exposes exactly where that system was already weak. Speed at the individual level and health at the system level are not the same measurement, and treating them as interchangeable is where most productivity claims go wrong. Bottom-quartile AI teams took more than 35 hours on average to merge pull requests. Top-performing teams merged pull requests in under 21 hours. "The Fast and Spurious" (Afroz et al.) found that collaboration patterns were unchanged despite speed gains, as AI accelerated individual work through faster task completion and higher output while leaving collaboration patterns unchanged and increasing code review burden and cognitive load from output verification.
Code quality as the signal that traditional metrics bury
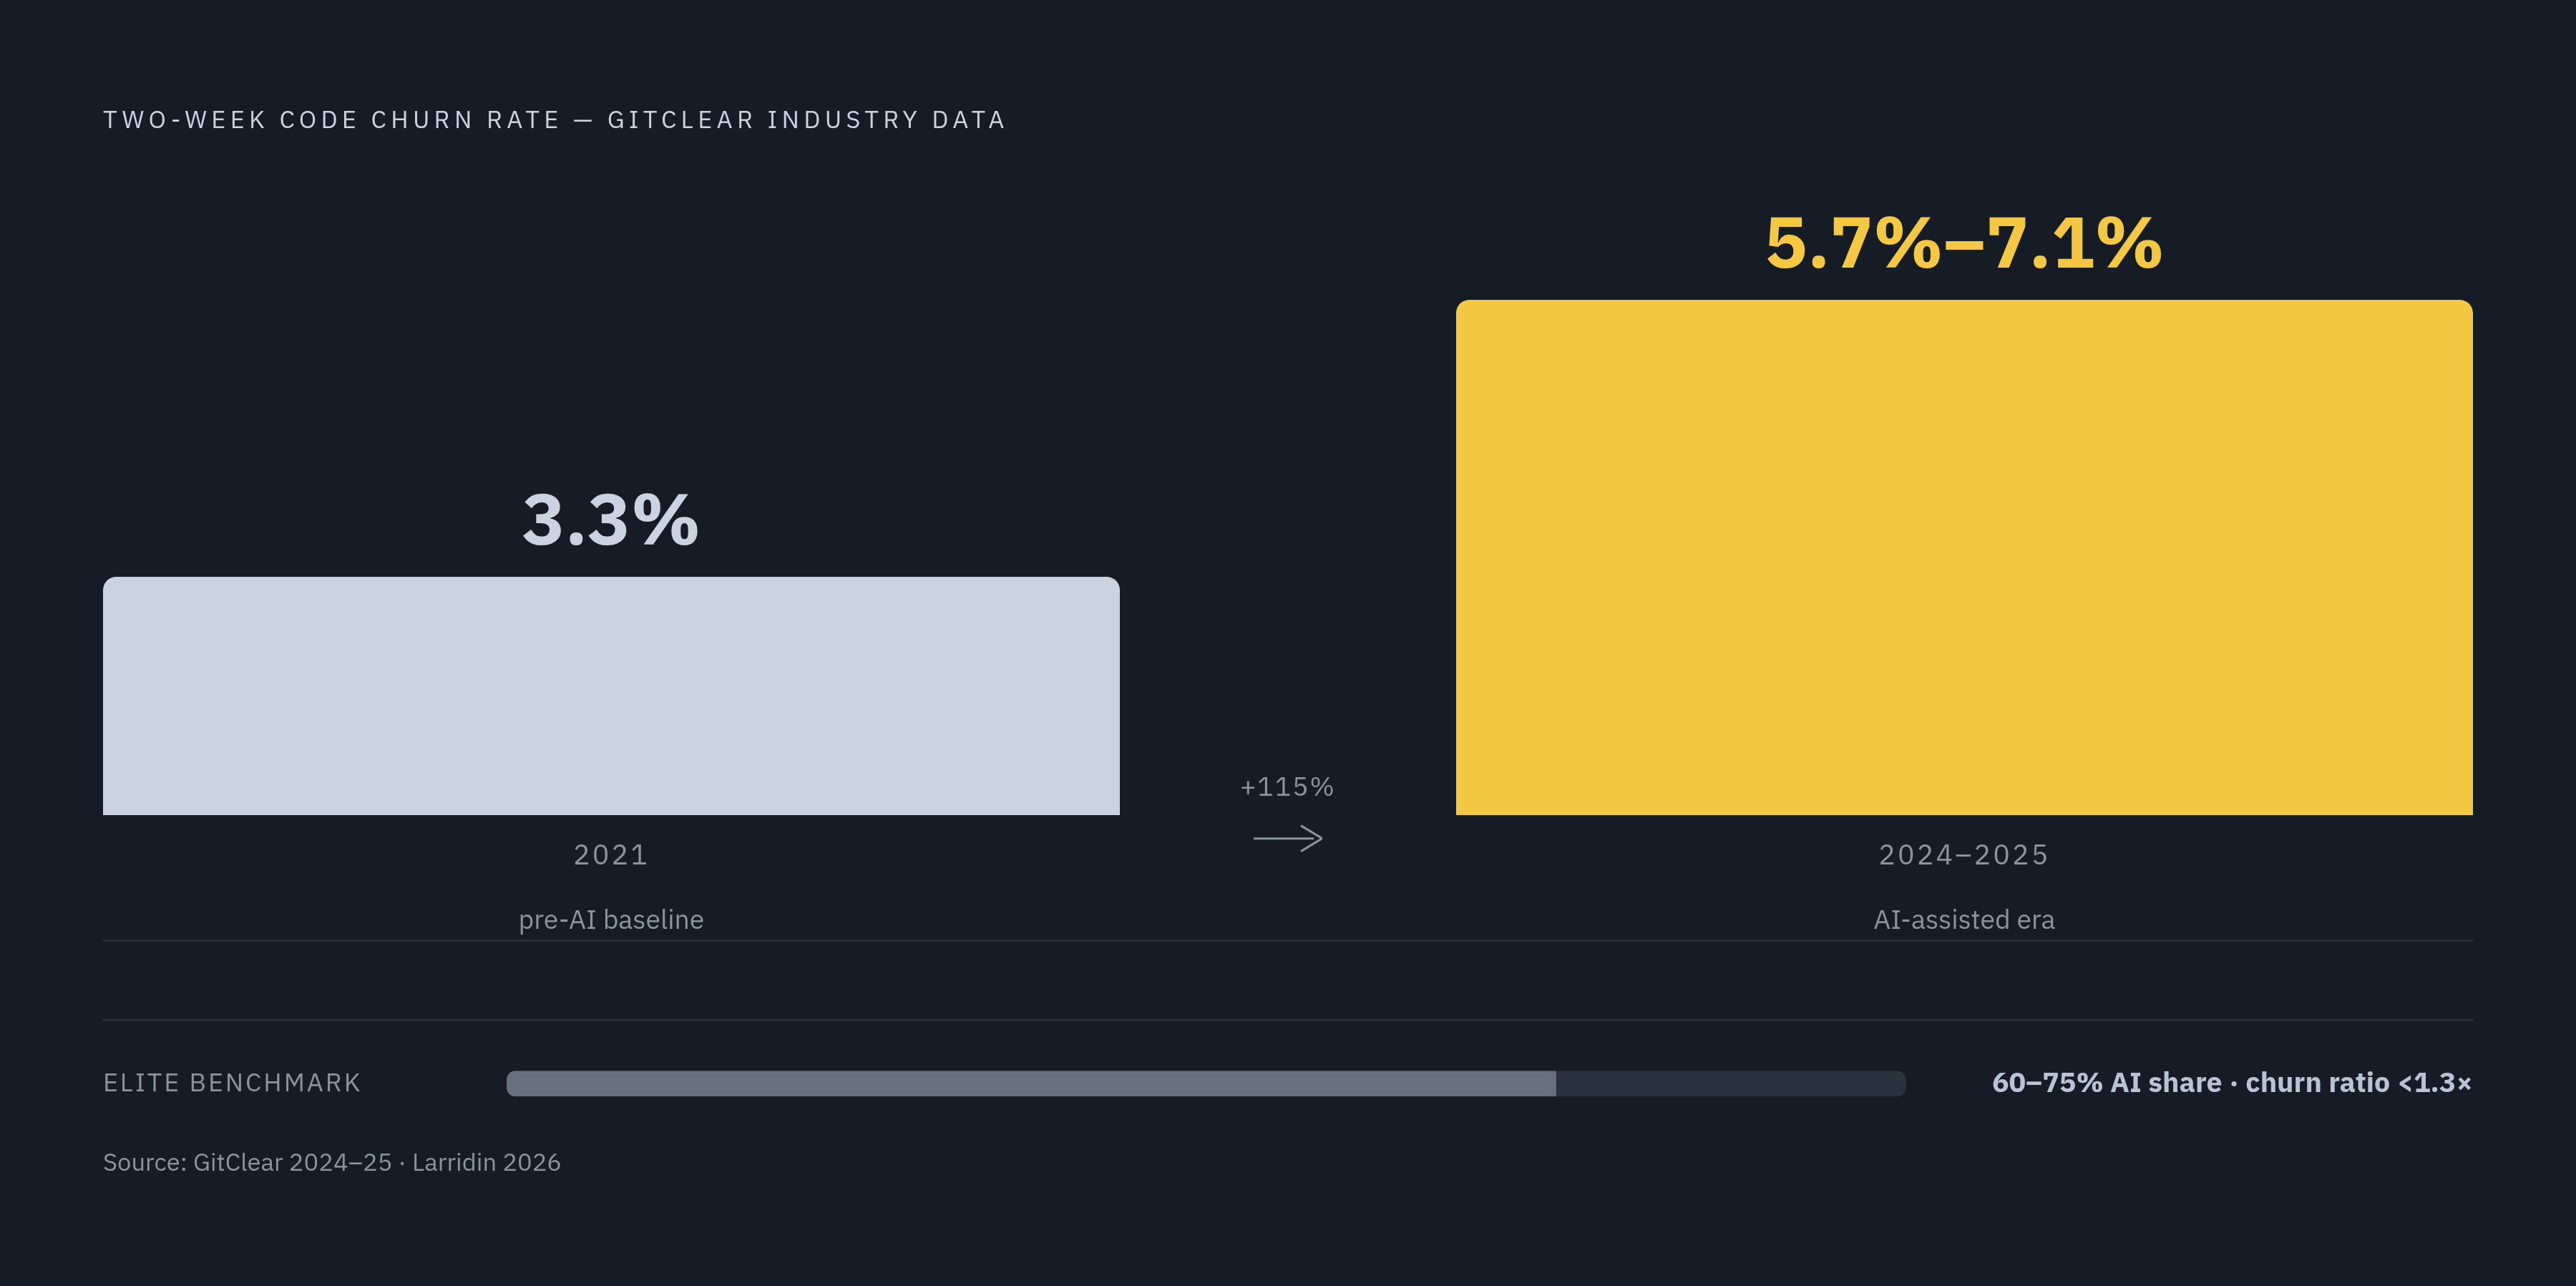
Code churn, the rate at which code gets rewritten or discarded shortly after being written, is one of the clearest tells available. GitClear data shows churn within two weeks of code being written sat at 3.3% back in 2021, before AI tools were widespread. By 2024 through 2025, that figure had climbed to somewhere between 5.7% and 7.1% across the industry. Code is getting written faster and getting thrown away faster, too.
Larridin's 2026 Developer Productivity Benchmarks gives this problem a usable name: the AI versus Human Turnover Ratio. Elite teams hold their turnover ratio below 1.3x even while running AI-assisted code shares of 60 to 75%, which proves the discipline is achievable rather than aspirational fullscale.io.
Trust data reinforces the churn numbers. The Cloud Security Alliance, working with Endor Labs, found that 62% of AI-generated code contains a design flaw or a known vulnerability kusari.dev. Vella and Blincoe describe the underlying mechanism as a creation-to-verification shift: 82% of their study's participants said they spent less time writing code and more time directing, evaluating, and correcting what the model produced. That's real labor, and it appears instead in the time spent on review, testing, and integration rather than in a lines-of-code dashboard. Volume metrics inflate under AI. Churn and turnover ratios deflate the illusion those volume metrics create, which is why a serious framework needs both. Only 29–46% of developers trust AI outputs, according to an index.dev report kusari.dev. 46–68% of developers report quality issues or incorrect outputs kusari.dev.
The five dimensions a complete measurement framework needs to cover
Larridin's 2026 Developer AI Impact Framework organizes the problem into five pillars, and Plandek's RACER framework along with SPACE framework research fill in the delivery and experience dimensions that Larridin's model touches more lightly.
The first pillar is adoption, treated as a foundation layer rather than the finish line. Weekly active usage above 80% marks the elite tier; usage still below 50% after 90 days signals friction that teams should investigate rather than wait out. Power user density, the share of developers using the tools daily and across multiple features, turns out to be a leading indicator: teams with more than 20% power users see overall adoption pulled upward by that group Intuition to Evidence: Measuring AI's True Impact on Developer Produc…. And because 70% of developers now run two to four AI tools at once, according to a survey from The Pragmatic Engineer, any adoption metric tied to a single vendor's dashboard is measuring the wrong thing.
The second pillar is AI code share, the volume of code written with AI assistance, but volume only means something in context. Industry average is 15 to 25% of lines written with AI help, top quartile runs 40 to 60%, and elite teams push past 75% fullscale.io. Taken alone, that number is a vanity metric. Paired with quality data, it becomes useful.
The third pillar replaces raw throughput with complexity-adjusted velocity. Complexity-Adjusted Throughput weights pull requests by difficulty, easy work at one point, medium at three, hard at eight, which stops AI from inflating a team's numbers simply by clearing out trivial tickets. Elite teams post sub-8-hour cycle times on AI-assisted pull requests against an industry average of 24 to 36 hours, and the AI velocity multiplier, AI-assisted throughput against human-only throughput, averages around 1.7x industry-wide and 1.8 to 2.0x among elite teams. That multiplier compresses sharply on hard pull requests, precisely where current tools help least.
The fourth pillar is code quality and survivability, tracked through 30-day and 90-day turnover rates segmented by whether code was AI-assisted or human-written. Alongside that sits innovation rate, the share of engineering effort going toward new features rather than maintenance, which answers a question turnover ratios can't: is AI generating new value, or just recycling rework faster.
The fifth pillar is ROI, but only when the cost side of the ledger is honest. Healthy ROI runs 2.5 to 3.5x on average and 4 to 6x for top-quartile teams, per Larridin's benchmarks, and that figure is only valid when token and usage-based costs are counted alongside seat licenses. Agentic tools in particular carry per-engineer token costs well above what a simple completion tool charges, and leaving those out makes ROI look better than it is. Developer experience belongs on this ledger too. Vella and Blincoe's finding, that 27% of matched participants reported worsened experience in at least one dimension after six months, is a cost signal as much as a wellbeing one, because burnout and attrition carry a price tag. The AI vs. Human Turnover Ratio is considered healthy below 1.3x, a watch level at 1.3–1.5x, and a warning above 1.5x.
How agentic workflows change what each dimension measures
Agentic tools don't just speed up the same job, they change what the job is. Sundar Pichai has said that as much as 75% of new code at Google is now AI-generated, describing engineers less as prompt writers and more as supervisors of autonomous agent teams fullscale.io. That's a shift in kind, not degree. Anthropic's Agentic Coding Trends Report backs this up with a specific number: developers use AI across roughly 60% of their work, but they can fully hand off, with zero oversight, only 0 to 20% of it Measuring the Impact of Early-2025 AI on Experienced Open-Source Deve….
Scale data makes the stakes concrete. Measurement infrastructure built for the old rate of growth simply won't hold at that scale. Cursor's adoption numbers tell a parallel story: developers at more than half the Fortune 500 now use it, and Stripe rolled it out to its more than 3,000 engineers, with over 70% actively using it according to Cursor's own published case study Intuition to Evidence: Measuring AI's True Impact on Developer Produc…. Any framework has to work across a heterogeneous mix of tools, because that's the actual environment teams operate in.
Under agentic conditions, each of the five pillars needs a redefinition. Adoption metrics need to capture agent invocations and task handoffs alongside autocomplete accepts. Code quality metrics need to track agent-generated pull requests separately from human-initiated ones, since the failure modes differ. ROI calculations need a token-cost-per-agent-run line item, distinct from and larger than per-completion costs. And context quality becomes its own variable: agents working from incomplete or fragmented repository context produce weaker output no matter how capable the underlying model is, which means context coverage needs to be measured alongside output quality, not assumed away.
The infrastructure connecting agents to external tools and data has matured fast enough to make this concrete. The Model Context Protocol, introduced by Anthropic in November 2024 and donated to the Agentic AI Foundation, a directed fund under the Linux Foundation, in December 2025, is now the de facto standard for that connection, with its Python and TypeScript SDKs pulling roughly 97 million monthly downloads workos.com. That volume means the context layer is production infrastructure now, not an experiment running on the side. Researchers studying it have flagged real security considerations, malicious code execution, credential theft, gaps in authentication, which means security posture belongs inside the measurement framework rather than sitting off to the side as a separate concern. Real-world longitudinal scale data from arXiv paper 2509.19708 tracked an in-house AI code generation platform across 300 engineers over one year from September 2024 to August 2025, during which AI-generated code grew from 3,000 to 2.26 million lines over six months, roughly 40% of production code was AI-generated by August 2025, and production code volume increased by 28%, showing that at scale, measurement infrastructure must handle orders-of-magnitude volume growth Intuition to Evidence: Measuring AI's True Impact on Developer Produc… truefoundry.com workos.com.
Self-Hosted Deployment and the Measurement Calculus for Security-Sensitive Teams
Not every team gets to adopt these tools freely, and the hesitation is not irrational. According to the Stack Overflow Developer Survey, 52% of developers either avoid AI agents entirely or stick to simpler assistants, with the hesitation concentrated around model control, cost at scale, and, most pointedly, where their source code actually goes securityboulevard.com. That last concern is not paranoia. Every major cloud-based AI coding tool sends code to external servers to run, and for teams operating under HIPAA, ITAR, or data residency rules, that's a hard constraint rather than a preference to weigh against convenience.
A handful of self-hosted options exist for teams in that position. Tabby offers a production-ready self-hosted code completion server where no data leaves the organization's own infrastructure, with multi-user authentication, usage tracking, and audit logging built in, positioned as a self-hosted alternative to cloud-based completion tools for enterprise use. Continue paired with Ollama gives teams a fully local setup inside VS Code and is the fastest route to private AI coding available right now. Aider or Claude Code combined with amux forms the most capable self-hosted agentic stack for teams that need to orchestrate multiple agents in parallel. Polyant takes a different angle as a self-hosted enterprise agent platform, running on a customer's own systems, whether on-premises, in the customer's cloud account, or on Exelab-managed EU infrastructure, and it captures interactions, tool calls, model usage, costs, and decisions in a queryable audit registry, giving compliance teams direct evidence to work from instead of a vendor's proprietary export.
The measurement payoff of going self-hosted is direct: it lets an organization instrument its own pipeline, telemetry, token costs, code churn, review latency, without depending on a vendor's dashboard that may never expose the data the five-dimension framework actually needs. For a security-sensitive team, that's a necessity, and often the only way to run the framework.
Building the measurement practice: what to instrument, in what order
None of this framework works if a team tries to stand it up all at once. Adoption data comes first, because without knowing who's actually using these tools and how deeply, every other number is unanchored. Complexity-adjusted velocity comes after that, once a team has enough baseline data to weight pull requests by difficulty rather than count them raw. Code quality and survivability need to be instrumented in parallel with velocity, not bolted on afterward, because churn data collected retroactively is far less useful than churn tracked from day one. ROI comes last, and deliberately so: it's the pillar most easily gamed by an incomplete cost model, and it should only be calculated once token costs, review overhead, and developer experience data are all sitting in the same system. The point of the exercise was never to prove AI works. It was to find out, with precision, where it does and where it doesn't, and build the delivery system accordingly.
Sources
- What AI Is Really Changing in Software Delivery in 2026
- Developer Productivity Benchmarks 2026 | AI-Native Engineering Data
- The Impact of AI Coding Assistants on Software Engineering: A Longitudinal Study
- The Fast and Spurious: Developer Productivity with GenAI
- Intuition to Evidence: Measuring AI's True Impact on Developer Productivity
- Measuring the Impact of Early-2025 AI on Experienced Open-Source Developer Productivity - METR
- Developer AI Impact Framework for AI-Native Developer Productivity (2026)