DORA Metrics Limitations for Complex Multi-Team Engineering Organizations
DORA metrics miss coordination overhead and dependencies that shape large engineering orgs.
DORA metrics tell engineering leaders how fast code moves through a pipeline. They were never built to explain why a large engineering org feels slower than the sum of its parts, and applying them at that scale produces predictable blind spots around coordination, dependencies, and attribution. This piece maps those blind spots and the measures engineering leaders are layering on top to close them.
What DORA metrics were built to measure
Out of that work came four core numbers: deployment frequency, lead time for changes, change failure rate, and time to restore service, with a reliability measure folded in later. The point of the exercise was never abstract. Accelerate, the book that codified the findings, showed elite performers on these metrics were roughly twice as likely to hit organizational performance targets, and the metrics were designed as proxies for pipeline health, not organizational health.
DORA measures how efficiently code moves from commit to production. It says nothing about whether that code was worth writing, how it got produced, or what conditions inside the organization made the number look the way it does. It's a boundary, drawn on purpose, around a specific question: how healthy is this delivery pipeline? The trouble starts when organizations stretch that boundary to answer questions DORA was never built to touch, which happens once a company scales past a single team shipping through a single pipeline. DORA's origin traces to research across 31,000 developers, published through the State of DevOps reports starting in 2014, before the framework was acquired by Google in 2018 (uplevelteam.com, TechCrunch).
DORA's creators acknowledged the framework's limits in 2025
The 2025 DORA report made two changes that read less like refinements and more like an admission. First, the report retired the elite/low/medium/high performer tiers that had defined DORA benchmarking for years, replacing them with seven team archetypes, acknowledging that similar DORA scores can describe fundamentally different organizational realities.
The companion 2025 State of AI-Assisted Software Development report, drawing on responses from nearly 5,000 technology professionals, put the point in plain language: software delivery metrics alone are no longer sufficient oobeya.io TechCrunch. They tell you what is happening. They don't tell you why oobeya.io TechCrunch. For multi-team organizations, the archetype shift changes which teams' practices get held up as the standard others are measured against. Two teams inside the same company can post identical DORA scores while one operates in a genuinely sustainable rhythm and the other grinds through unsustainable pressure to hit the same numbers, and the dashboard alone gives no way to tell which is which. None of this discredits DORA. It's the framework's own creators catching up to something large-org practitioners had already figured out on the ground: the metrics are necessary, but at scale they stop being sufficient on their own.
Aggregating DORA scores across teams produces numbers that explain nothing
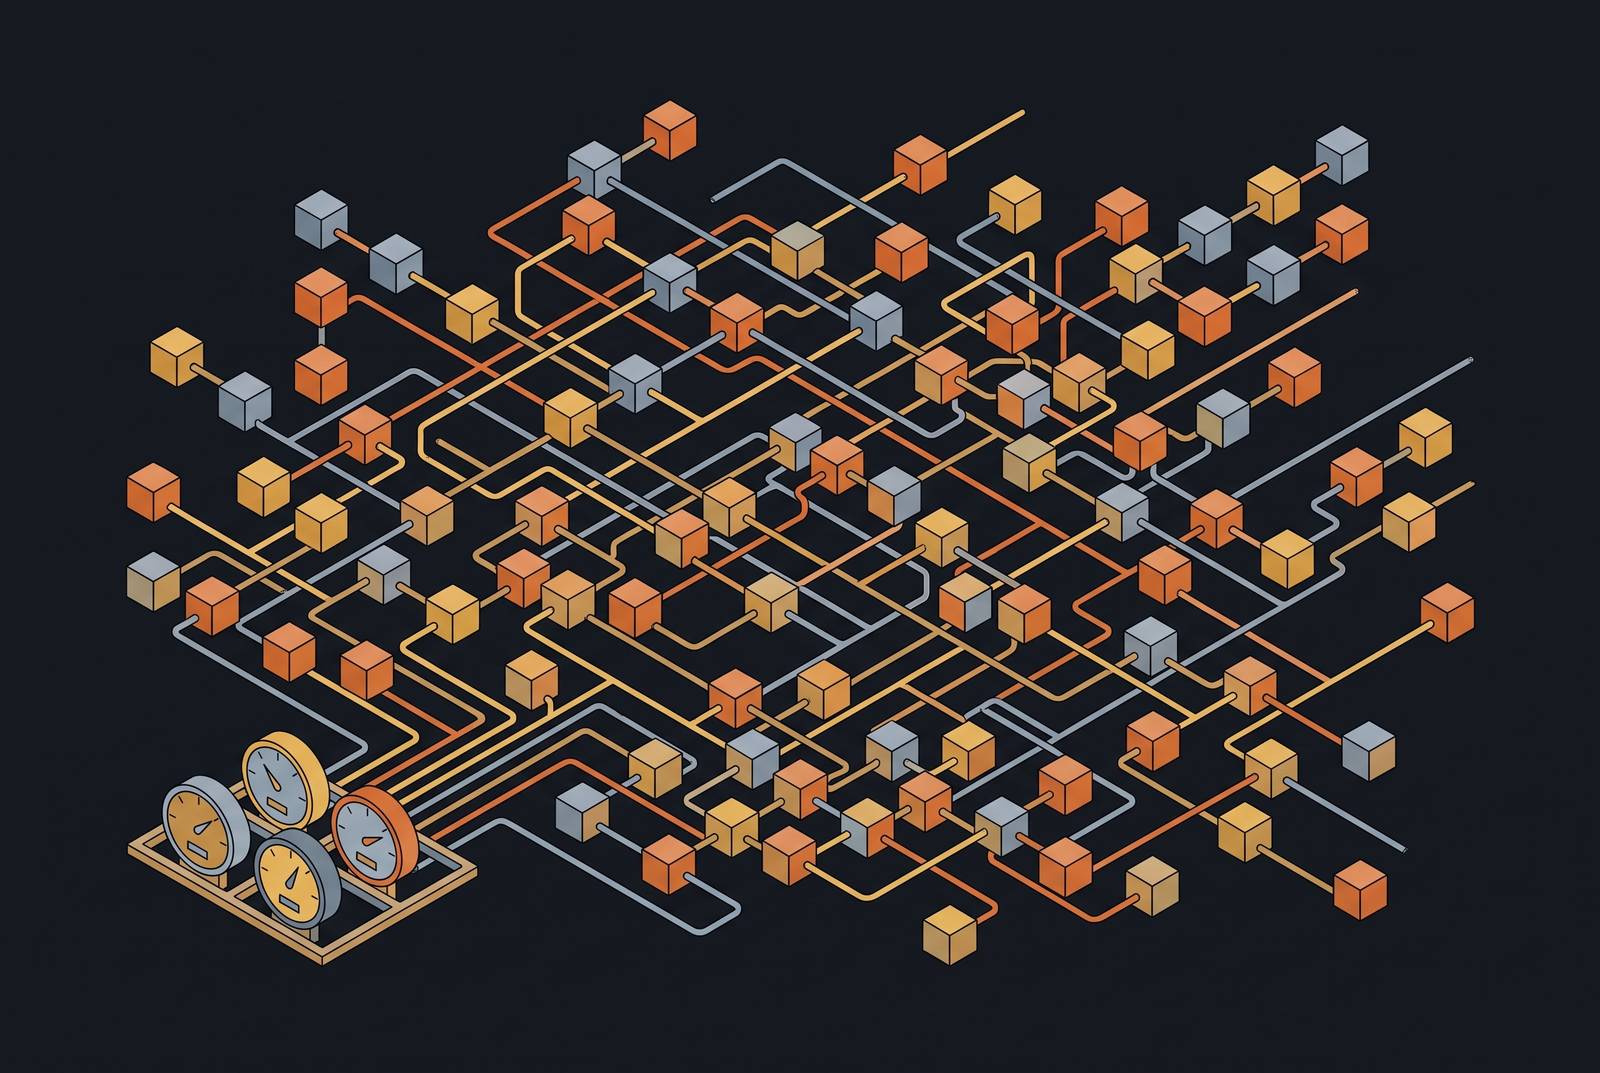
DORA was built around the idea of one team and one pipeline. Roll that up across dozens of teams, and the resulting average hides more than it reveals. A single deployment frequency figure for "the engineering organization" might blend teams shipping multiple times a day with teams that deploy less than once a month, and the aggregate number speaks clearly to neither situation. The seven-archetype model underscores exactly this problem: DORA's own researchers introduced archetypes because teams that look the same on paper are not interchangeable, and aggregation is precisely the operation that erases that difference TechCrunch.
Research from DX finds engineering organizations posting elite deployment frequency are often still spending most of their R&D time on maintenance rather than new capability work, a fact the aggregate score does not capture. Teams with strong DORA numbers report high friction all the same. The org-wide roll-up gives leadership a false sense that they can see what's happening, when in reality the number is real but tells them nothing they can act on without breaking it back down team by team. Self-reported data compounds the issue further: some of DORA's inputs come from survey response, which introduces its own bias, and pooling biased inputs across many teams doesn't average the bias out, it just buries it deeper.
Coordination overhead: the 41% of organizational work DORA does not see
DORA measures what happens inside a pipeline. It has nothing to say about the work required to keep several pipelines pointed in the same direction. That includes negotiating dependencies with another team's API or shared service before a change can even start moving, along with architecture decisions that span team boundaries, technical debt remediation that consumes capacity without ever producing a deployment event, and the mentoring and onboarding that keeps a growing org functional. A dashboard built to track commits and deploys does not record any of it.
Atlassian's State of Teams 2025 research found teams lose something like a quarter of the workweek just searching for information, a cost with no line item in any DORA report. Layer coordination time on top of that, and DORA metrics capture deployment pipelines but ignore a large share, by some measures around 47%, of developer time spent specifically on coordination work, a share big enough to decide whether a team's headline numbers are sustainable or are being propped up by hours nobody is tracking blog.exceeds.ai. Platform engineering adds its own wrinkle here. Gartner expects 80% of large software engineering organizations to have stood up platform engineering teams by 2026, up from 45% in 2022, and yet DORA has no mechanism for measuring the cross-team latency those platform teams create or absorb. A platform team could be quietly saving every other team hours per week, or quietly adding friction at every handoff, and standard DORA tracking would show neither. A team can post an elite deployment frequency while its engineers spend the bulk of their working hours on coordination overhead that never touches the dashboard. DORA sees the output. It does not see the cost of producing it. Atlassian's State of Teams 2025 found teams spend roughly a quarter of the workweek searching for information (TechCrunch).
Cross-team dependencies and the compliance edge case where MTTR becomes meaningless
Lead time for changes assumes the clock is measuring pipeline performance. In a multi-team org, once a change needs sign-off from another team, or depends on a shared component someone else owns, the lead time figure starts measuring inter-team wait time instead, and it indicts the delivery pipeline for a delay the pipeline didn't cause.
Ownership gets murkier still when something breaks across a boundary. Change failure rate and mean time to recovery both become contested the moment a failure touches more than one team's code, because the incident log will show how long resolution took, but nothing in DORA points to which team's boundary was actually the binding constraint. Regulated environments push this further into absurdity. The fastest way to restore service is not always the path compliance allows: rolling back a database schema change might fix an outage in minutes, but it can also blow a hole in an audit trail that took months to build. Two organizations can post identical MTTR figures while living in entirely different worlds, one with a mature incident response practice, the other stuck waiting behind a compliance review queue that has nothing to do with engineering skill. In a single team's pipeline, the metric and its cause sit close together, close enough that reading one tells you something true about the other. Cross team, and especially inside regulated workflows, that coupling comes apart, so the metric stops pointing at what it was built to measure. The DORA MTTR reflects not engineering capability but the friction between technical and compliance requirements, and the metric provides no visibility into which is the binding constraint.
AI coding tools and the DORA attribution problem
DORA has no field for where code came from. It tracks deployment, failure, and recovery, but not whether the code was AI-assisted or human-authored. That gap used to be a rounding error; it no longer is. A team can watch its deployment frequency climb because AI tools help produce code faster, while change failure rate worsens at the same time because that same code is harder to review or maintain, and DORA will show both trends without ever connecting them. Sonar's State of Code Developer Survey found developers estimate 42% of their committed code is AI-assisted at this point, and standard DORA tracking has no way to see which tools are driving results or where the adoption is creating risk blog.exceeds.ai TechCrunch.
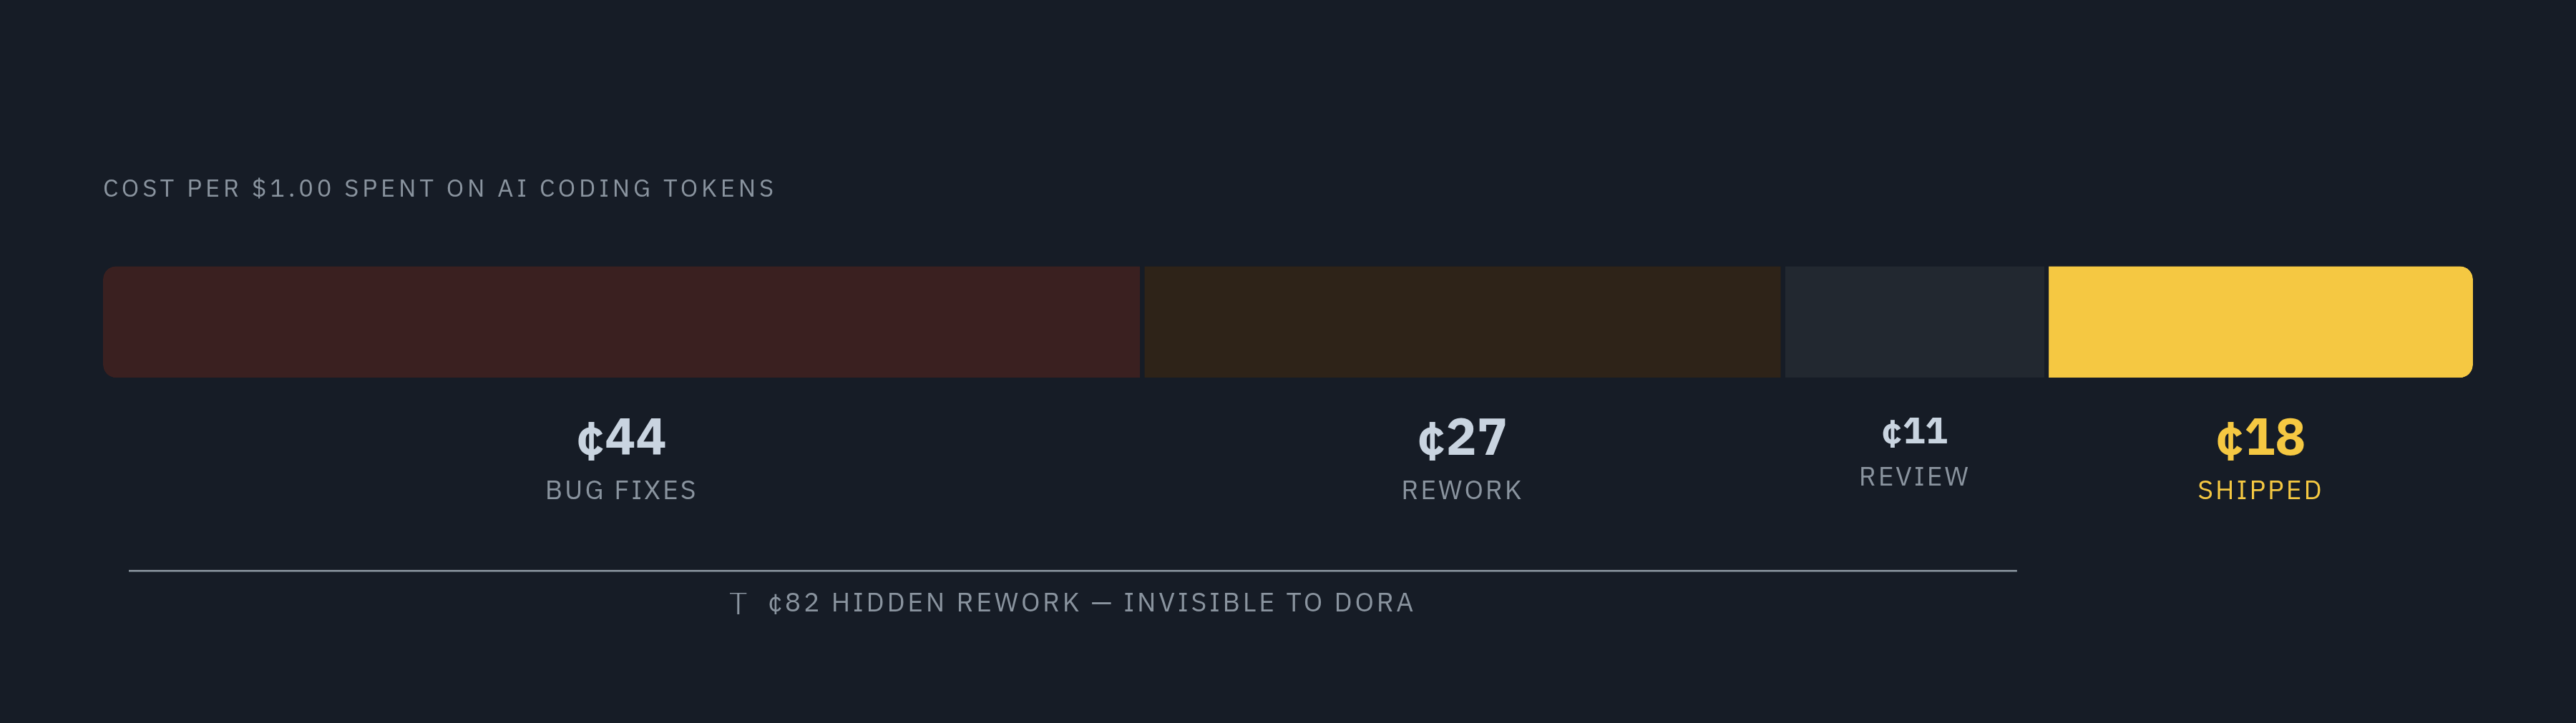
The quality data backs up the concern. GitClear's 2025 longitudinal study, covering 211 million changed lines, found two-week code churn rose from 3.1% to 5.7% between 2020 and 2024, with AI-assisted code churning at a noticeably higher rate than human-written code, a trend invisible on any standard DORA dashboard blog.exceeds.ai TechCrunch. A separate large-scale study of 6,299 GitHub repositories found AI-authored commits introducing their own distinct set of issues, mostly code smells, and a good share of them still sitting in the latest version of the repository, unresolved blog.exceeds.ai. Incidents tied to AI-generated code tend to surface 30, 60, even 90 days after the merge, well past the window any DORA dashboard is watching, so change failure rate can look perfectly stable while real risk builds because it is not being measured. DORA's own 2025 report frames AI as an amplifier rather than a fixer: strong teams get stronger with it, while struggling teams find AI intensifies the problems they already had, and without attribution built into the metrics, there's no way to tell which dynamic is actually playing out inside a given org TechCrunch. Exceeds AI's cost analysis puts a number on the stakes: of every dollar spent on AI tokens, roughly $0.44 goes toward fixing bugs the AI introduced, $0.27 toward rewriting or reworking AI output, and $0.11 toward review friction and merge overhead, leaving about $0.18 as actual shipped value blog.exceeds.ai. DORA sees none of that cost structure blog.exceeds.ai. Quality erosion is a signal that DORA misreads.
What DORA misses about developer experience and delivery performance
DORA measures the pipeline. It says nothing about the people running it. Research from DX points to a long list of things the framework simply doesn't capture: developers getting protected time for deep, uninterrupted work, senior engineers drowning under review load across too many teams, and how much cognitive load a given system imposes on the people maintaining it. High-maturity platform engineering teams cut cognitive load substantially for the engineers who depend on them, an improvement that changes daily working life but is never recorded as a DORA number. Trust in tools matters too, particularly AI tools whose output quality swings from genuinely useful to actively harmful depending on the task.
Atlassian's workforce research names this an "AI efficiency paradox": individuals produce output faster with AI assistance, but that output then piles up at review, at approval, at every point that still requires a human to actually judge it, and the bottleneck eats much of the speed gain before it ever reaches the system level TechCrunch. DORA shows the individual throughput number climbing. Elite DORA scores and deteriorating developer experience can coexist for extended periods, and the metrics give no early warning: the experience degradation is only visible later, in attrition or quality failure. With 51% of professional developers now using AI tools daily, how people actually experience those workflows, frustration, trust, friction, has become a real driver of delivery performance, and it sits entirely outside what DORA measures blog.exceeds.ai.
Supplementary frameworks engineering leaders use to fill these gaps
None of the frameworks built to answer these gaps argue for throwing DORA out. The shared premise is layering: delivery pipeline metrics stay as a necessary baseline, and something else gets built on top. DX Core 4, developed with input from researchers behind DORA, SPACE, and DevEx, organizes measurement into four balancing zones: Speed, Effectiveness, Quality, and Impact. A team can inflate Speed by merging a flood of AI-generated pull requests, but it can't inflate Effectiveness at the same time if review pressure is climbing and developer trust is falling. Impact, meanwhile, gets defined concretely as the percentage of R&D time going to new capabilities versus maintenance, a number that non-technical stakeholders can actually read and understand without translation.
Some teams are decomposing lead time itself rather than reporting a single blended figure, breaking it into coding time, pickup time, review time, and deploy time, which shows exactly where a bottleneck has moved instead of hiding it inside one average. DORA's own 2025 report also introduced an AI Capabilities Model, a seven-part checklist covering things like AI stance, data ecosystems, AI-accessible internal data, and version control practices TechCrunch. It isn't a measurement dashboard, but as an audit tool run alongside the metrics, it gives leaders a structured way to ask whether the organization is actually set up to use AI well TechCrunch. Oobeya and Exceeds AI research shows leading teams are tracking AI-specific attribution metrics. Another is code turnover rate (the percentage of code reverted or substantially rewritten within 30 or 90 days), which catches fragile AI-generated code before it fails in production. Teams are also tracking incident attribution by code origin: connecting production failures to whether affected code was AI-assisted, and on what timeline.
Codebase context as a prerequisite for reliable AI agent contributions in large multi-team orgs
Much of the AI-driven quality erosion traces back to a mechanical problem, not just a cultural one. AI coding agents working in large codebases default to local, file-by-file navigation: grep, find, one file read after another, and that approach burns through context windows before the agent ever builds a real understanding of cross-team dependencies or how the architecture actually fits together. In a multi-team org, that failure gets expensive fast. An agent that can't trace a function call across a repository boundary, or doesn't understand who owns what, will write code that looks fine locally and breaks something else entirely, and that failure appears weeks later as a spike in change failure rate.
Research from Atlan found that AI agents working with governed, structured codebase context perform dramatically better than agents working without it, and no amount of clever prompting closes that gap. That finding connects directly back to DORA's attribution blind spot: when AI-generated code fails more often, part of the mechanism is simply that the agent never had enough context about the codebase to write something sound, not merely that AI was involved at all. A handful of approaches now in production try to solve exactly this by giving agents structured code intelligence instead of raw file access. Colby McHenry's codegraph builds a local-first semantic knowledge graph of a codebase and, at scale, cuts cost by roughly 35% and tool calls by around 70% on large, real-world repositories. DeusData's codebase-memory-mcp takes an open-source route, indexing a codebase into a persistent knowledge graph across 162 languages, combining hybrid LSP type resolution with local semantic vector search, code-clone detection, and sub-millisecond queries, built specifically to answer structural questions using far fewer tokens than an agent reading files one by one would need. Neither approach changes what DORA measures. Both change whether the code DORA is measuring was ever likely to be sound in the first place.