Dependency Mapping Across Dozens of Microservices Repositories
Combining code analysis, runtime data, and SBOMs reveals hidden dependencies at scale.
Enterprise code search lets teams find their way through code across repositories, but dependency mapping needs more than a text match. For large microservices fleets, the useful approach combines cross-repository code intelligence, runtime observation, and software bills of materials in a continuously updated graph. This article explains why that graph must become shared infrastructure for incident response, maintenance, security audits, and AI-assisted development.
Why dependency graphs stop fitting in engineers' heads past a certain fleet size
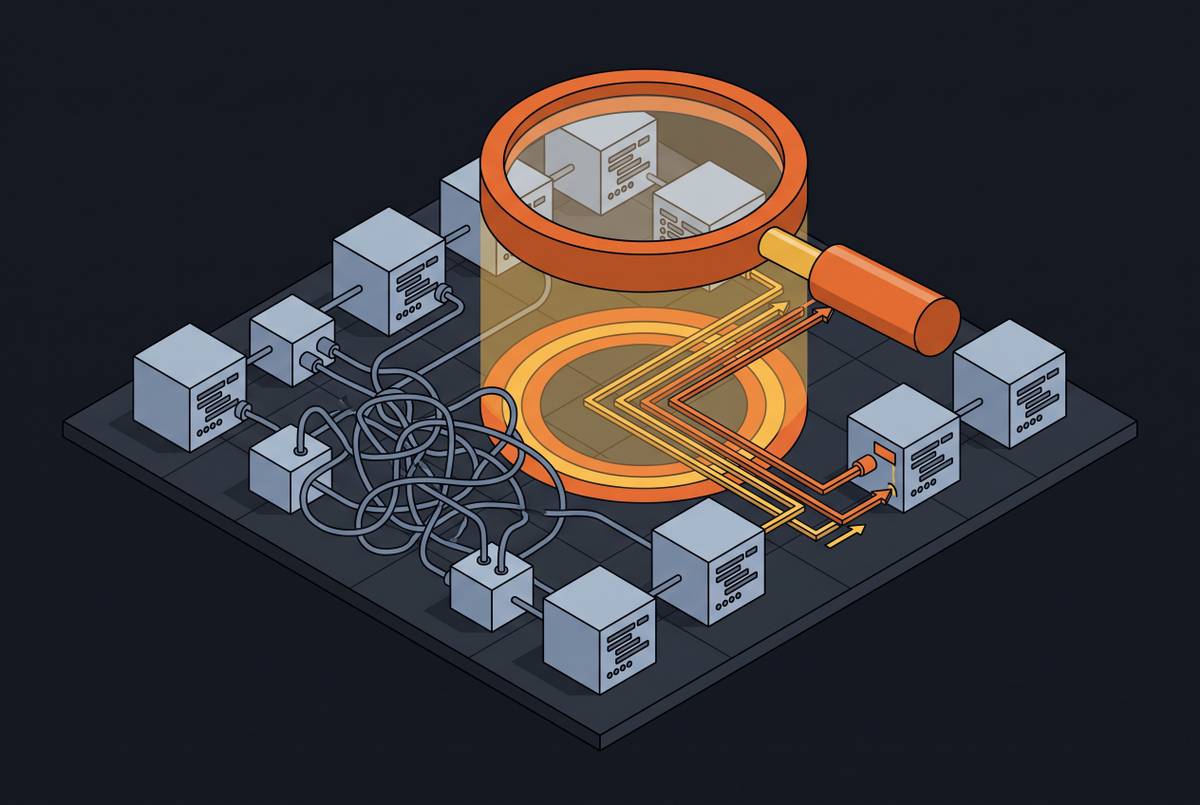
At 2 AM, monitoring is green, the database is healthy, and the application server looks fine, yet the system is down. No one can trace which components depend on which. The missing information is the path between them, including the shared infrastructure and indirect dependencies that local checks do not explain.
At roughly 30 repositories, informal architectural knowledge stops being a dependable operating model. Below that threshold, an experienced engineer may know which services use the VPC module without looking anything up. Beyond it, the same question produces guesses, Slack polling, and hours of manual searches that still miss consumers. The fleet usually grows to this point as microservices get their own repositories one by one.
What a useful dependency map must model — and what most teams leave out
A relationship records that service A communicates with service B. A dependency records that A cannot function when B is unavailable. Treating every communication path as a failure path obscures priorities, because contact alone does not establish criticality. A useful map distinguishes observed communication from a dependency whose failure has operational consequences.
That distinction also exposes coupling without direct calls. Two services can depend on the same database cluster or cache without ever communicating with each other. Shared infrastructure therefore belongs in the graph, as do indirect library inclusions and data coupling. API specifications describe contracts, but protobuf, OpenAPI, and GraphQL do not inherently maintain a fleet-wide inventory of downstream consumers and field usage.
Evidence is as important as the edge itself. Each dependency needs its observation source, last-confirmed time, direction, service owner, and criticality. Without those details, readers cannot tell a critical dependency seen recently from an old assumption. Infrastructure changes, containers come and go, and new services appear, so a six-month-old map without continuous updates can create false confidence and leave uncertainty unresolved.
The four discovery methods and what each one sees and misses
Distributed trace analysis extracts service-to-service communication from spans, capturing actual behavior and dynamic dependencies. Its view depends on what runs during the observation window. A dormant dependency remains invisible until traffic exercises it. Static code analysis fills in the view by reading manifests, imports, and source references, though it can include dead code and miss runtime-constructed URLs or dynamic service discovery.
Network flow and service mesh observation capture traffic at the infrastructure layer, exposing undocumented communication paths. Visibility still depends on the observation boundary. These methods require network access and can generate noise, while mesh observation only covers in-mesh traffic and discovery can miss non-DNS resolutions. Runtime evidence therefore cannot stand in for a complete inventory of dependencies present in code.
SBOM ingestion and manifest aggregation centralize build-level component information and support fleet-wide security and compliance analysis. They do not replace evidence of runtime behavior. Polyglot coverage also requires normalization across formats such as pom.xml, package-lock.json, poetry.lock, go.mod, and packages.lock.json. A platform needs at least static analysis and runtime observation to work well, with SBOM data adding details about each component. Merging their outputs into one model is a separate engineering task.
How the dependency graph degrades incident response, planned maintenance, and security audits when it is incomplete
During an incident, an absent map forces responders to reconstruct blast radius while the outage is live. A current map can expose affected dependencies in seconds. Planned maintenance suffers from the same information gap, but Slack polling replaces urgent investigation. Asking whether anyone uses a service depends on the right people seeing the question and remembering the answer, including knowledge that may have left the organization.
A vulnerability in Jackson, urllib3, or requests requires finding every direct and transitive inclusion across the fleet. A service can have no vulnerable package in its own manifest yet ship one through an internal shared library. Manual manifest review misses that path entirely. Patching downstream services without fixing the shared library upstream allows the vulnerable dependency to return on the next rebuild.
The missing paths also weaken compliance evidence and coordination. Auditors cannot establish which services touch which data stores when lineage from source to sink is opaque. Likewise, an API change can affect a dozen applications with different owners and release timelines. Without a current consumer map, teams must find out by hand who owns those applications before work on the change can begin.
Building the graph — how static analysis, runtime observation, and SBOM aggregation work together in a fleet-wide pipeline
To move from diagnosis to construction, platform teams should define a common build contract across repositories. Every build should identify its manifests, generate a dependency report or SBOM, and upload it to a central system. Findings should route to the owning team. This standard prevents each service team from inventing its own scanner while giving the aggregator consistent inputs across languages.
The aggregator should then resolve transitive dependencies and build a fleet-wide component inventory. OWASP Dependency-Track supports centralized ingestion of CycloneDX SBOMs for component and dependency-risk governance. Static source analysis adds cross-repository references, and runtime observation shows what cannot be seen by reading the code. Dynatrace Smartscape discovers applications, services, processes, and hosts through continuous topology observation.
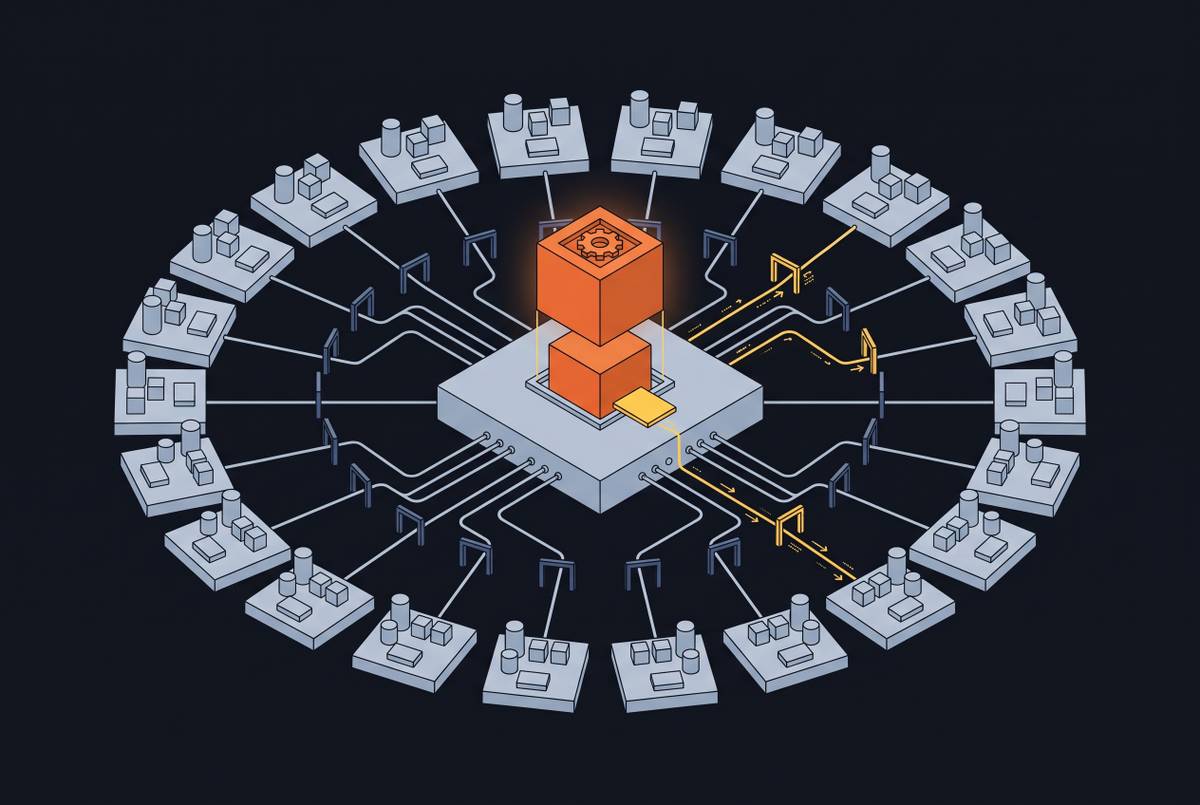
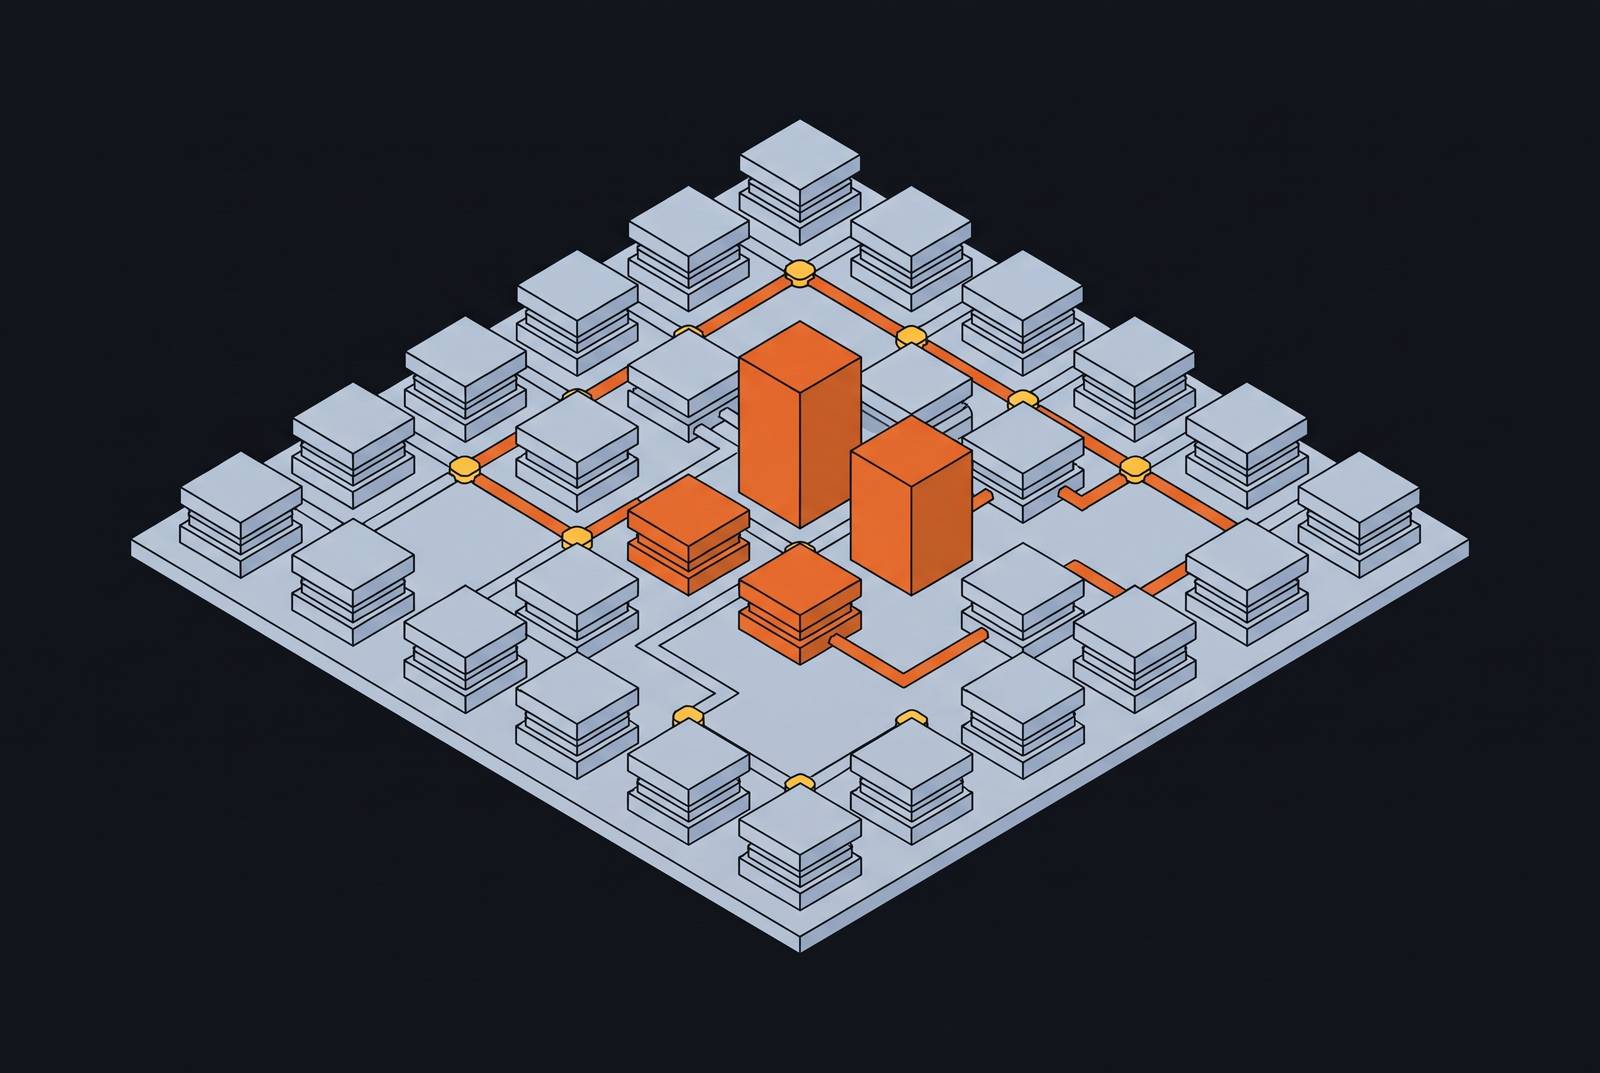
The merge stage should normalize their observations into a single graph model that unifies the disconnected inventories. Each edge should include its source, last-observed timestamp, direction, owner, criticality, and review status. Ownership must extend to shared internal libraries. A staleness tracker should keep track of when each edge was last confirmed, and push-triggered updates should pick up new services and dependency changes as teams work on the code. Regular runtime discovery complements those updates instead of making a fixed refresh schedule the sole source of freshness.
Which enterprise code search and mapping tools fit large, multi-repository codebases?
For codebases with millions of lines across multiple repositories, the selection criteria begin with the questions teams must answer. Code-level navigation needs an index spanning the fleet and an interface for finding references to symbols, functions, modules, shared libraries, and generated clients. A code intelligence layer lets engineers and agents query static relationships without searching through repositories by hand over and over.
Other categories address different gaps in that view. Dependency-Track serves centralized SBOM governance, while Smartscape supplies runtime topology discovery. ServiceNow ITOM addresses ITSM-integrated service mapping for organizations standardized on the Now Platform. Even with a component inventory or a runtime topology map, a team still needs source-level navigation to find every consumer of an internal library before rolling out an upstream fix.
The practical comparison is therefore coverage against the missing layer, together with fit to the existing ITSM or observability platform. Enterprise code search exposes code relationships, SBOM governance exposes component risk, and runtime mapping exposes observed topology. No single category covers the whole graph.
How AI coding agents make the dependency mapping problem worse before tooling catches up
An agent changing an API field can produce well-structured code while missing consumers outside its local repository. The field may be used by four other services, owned by another team, or passed into a third-party integration as sensitive data. The resulting defect may become visible only weeks later, when a consuming service breaks in production.
A precomputed graph changes how the agent obtains that context. Without one, it must reconstruct cross-repository relationships for each query, spending time and tokens on repeated discovery. The proposed division of labor is precise. Static analysis discovers dependencies, AI reasons about them, and the Model Context Protocol delivers the evidence on demand. Structured context calls reduce the need to load everything upfront or rediscover the same relationships repeatedly.
That delivery path also needs its own governance. OWASP identifies MCP risks including tool poisoning, privilege escalation through scope creep, supply-chain attacks, prompt injection through contextual payloads, and token mismanagement or secret exposure. Dependency evidence cannot simply become trusted because an agent receives it through a protocol. The context layer must be governed as part of the system whose changes it informs.
What the dependency graph enables for non-engineers once it is queryable
A graph that requires a senior engineer to interpret still leaves that engineer as the organizational bottleneck. A queryable interface lets product managers and support staff ask what a change could affect or which team owns the service handling a function. Natural-language access lets staff see those relationships without asking engineering each time.
New engineers benefit from the same access during onboarding. Questions about which services write to the payments database or depend on the auth shared library otherwise require repeated interruptions to experienced colleagues. Ownership and data relationships become available without scheduling a meeting. Each independently answered question removes an interruption from a coding session, while a current consumer list gives cross-team API changes a basis for structured notification, sparing teams another round of discovery.
Data privacy constraints that govern where dependency context may live and how agents may access it
For regulated enterprises, choosing where dependency context lives affects compliance and intellectual-property protection as well as where the tools are hosted. Cloud-hosted AI tools can transmit prompts and surrounding code context to a model provider, with the payload depending on configuration. Deployment labels alone do not establish the boundary. Some self-hosted products run execution on customer hardware while still sending context to a model in the vendor’s cloud.
Who can use the context layer needs just as close a look. Trend Micro found internet-exposed MCP servers with zero authentication. Check Point Research reported that poisoned repository configuration files could lead to remote code execution. These findings show why access control and auditability are needed, though they do not show that every MCP deployment is unsafe. Residency and access laws also constrain transfers to US-based providers, while EU enterprises face additional obligations under the EU AI Act.
A principled deployment can keep the dependency graph, code index, and MCP server inside the organization’s infrastructure. The system can connect to internal repositories and project management tools without routing code through external services. Bring-your-own-model flexibility then lets the enterprise choose which model receives code context, rather than leaving that decision to the tool vendor’s cloud configuration.
An operating model for keeping fleet-wide dependency maps accurate over time
To keep the pipeline trustworthy, platform teams should make graph ingestion part of every push. New services, manifest changes, and shared-library updates should trigger updates immediately. Review should test the evidence. Teams should check the map against architecture decisions from time to time to question false edges and flag dependencies that runtime observation has not confirmed recently, keeping in mind that dormant code dependencies may still be valid.
Teams should also assign an owner to every shared internal library and connect that ownership to remediation. When a critical vulnerability is found, teams should start the fix upstream and then roll it downstream. Surfacing blast radius when an alert or change ticket is created makes the graph part of the work, rather than a separate dashboard someone must remember to open.
Access should extend beyond the platform team to new engineers, product managers, and support staff. Architecture decision records, design patterns, and ownership information should be written once and made available to agents through MCP. This is the practical work of context engineering. A trustworthy, queryable dependency graph becomes the infrastructure layer that AI-assisted development can use instead of repeatedly trying to reconstruct the software estate.